FLOW BOULEVARD
LA Basin Travel Demand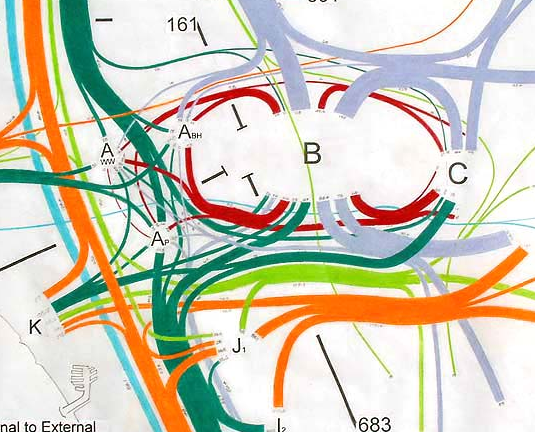
Abstract
This study covers east-west travel demand using a manual assignment technique. A comparison of actual 2005 travel counts is made with a 2030 projection, and then an assignment of that 2030 demand is made to two east-west possible Flow Boulevards namely the Santa Monica FB and the Venice/Washington FB. The projection increased travel demand by 26% to which most all was assigned to the Flow Boulevard corridors. No rail transit was assumed to be used. This was to show how powerful the FB concept is in the ability to move people and goods. The City is going to build some rail but it will also need to build multi-modal transportation improvement, the protection of existing residential communities from increased traffic and to develop quality pedestrian environment in commercial corridors that also move vehicles. (Comments made in 2007 follow)
Travel Demand and 2030 Assignment
The easy part: Bold print will be used to make this part easy for the person not familiar with traffic analysis. The key ideas will be in bold print so the novice can skip down the page getting the importance of travel demand as it relates to providing transportation facilities.
Affordable Connections of LA Centers with the FB System
The importance of studying and making a travel demand analysis of an area is so appropriate planning can be made to provide transportation facilities for that area. The traffic dilemma in Los Angeles west of downtown is not because the travel demand studies have been so bad; it is because the interpretation of the studies and the choice of facilities have been so bad.
The Centers Concept Plan of the 1960’s correctly identified Los Angeles as having many employment centers, not just one downtown as many east coast cities have. The concept of connecting the centers with mass transit established the Centers Concept Plan. The planners led by the politicians (and visa versa), failed to find an affordable mass transit facility with meaningful connections to the existing communities and centers. Meanwhile, Los Angeles continued to sprawl and travel by means of the freeway system, which has served very well to date. But now it is at capacity within the west LA area with no room to grow in length or width. Going up would be a fool’s errand except for small specialized functions. This same basic condition can be said for the San Fernando Valley, East LA and the South Bay area as well.
The choice of starting a subway was a bad one, because it was starting a system that was inherently unaffordable and could not be developed to provide for the travel demand generated by the population that lives here in Los Angeles . Light rail has some valid commuter functions, but it too is expensive taking too much of transportation improvement budgets, does not embrace the many existing centers, communities and corridors, and is essentially incompatible with the surface system of mobility here in Southern California .
Los Angeles is at a critical point now as evidenced by the mounting level of congestion and lack of affordable housing. The FB system of Elements will show that it is the affordable transportation improvement that accepts needed growth in corridors, connects the centers of Los Angeles and provides the capacity for the future travel demand.
Study Method
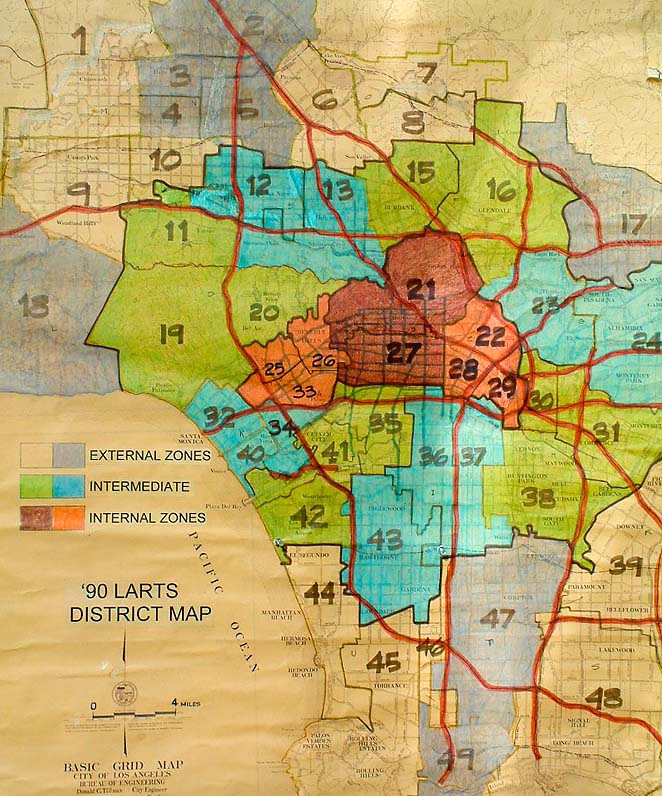
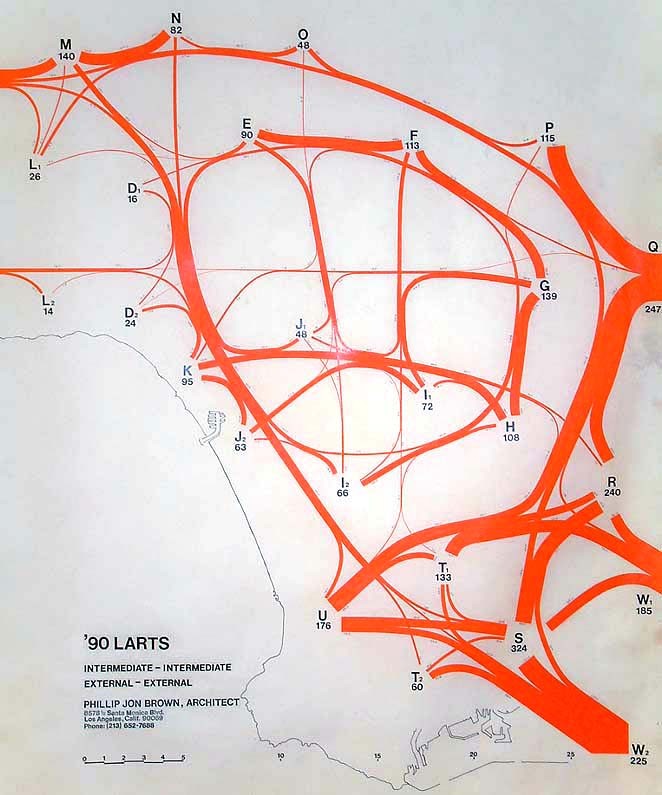
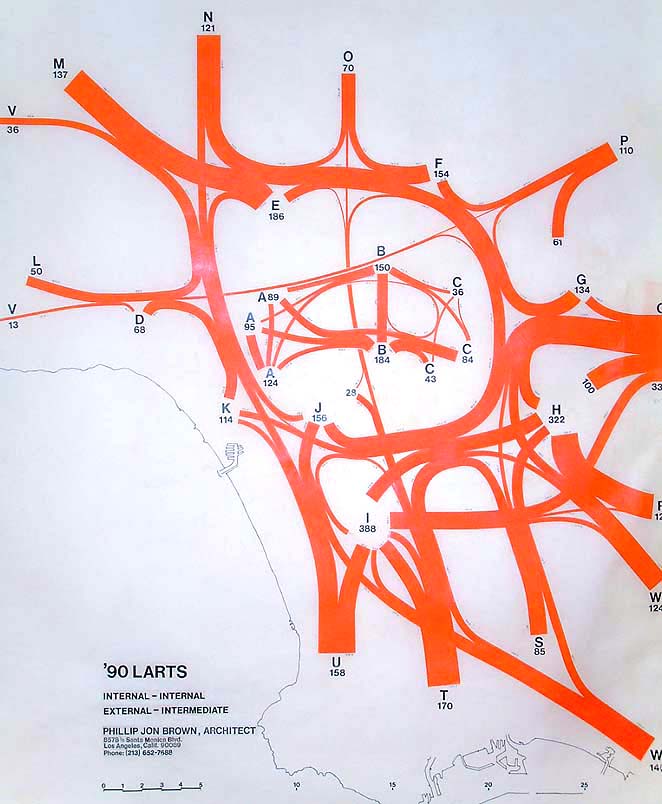
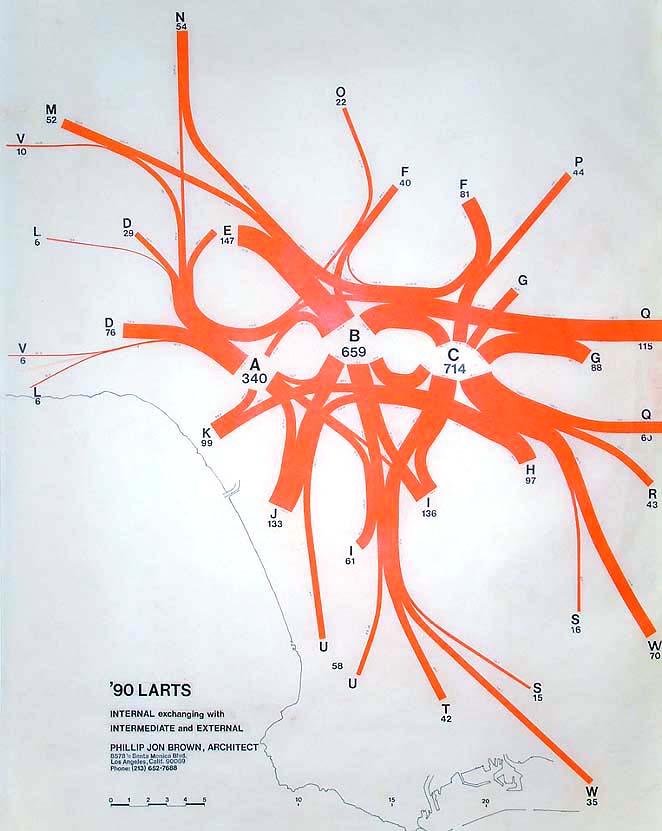
For the travel demand, from one area to another, the Los Angeles Regional Transportation Study 1990 (90 LARTS) will be updated. The 90 LARTS data has been put into diagrammatic form a/ using width of line to show volumes of trips between districts (see map), b/ on charts representing kinds of trips, differentiating internal, intermediate and external zones all exchanging trips with one another (see the District Map for the concentric zones and the three orange diagrams representing trips between all districts) and finally a map showing essentially a district or area bound kind of short trip that supposedly does not leave a district ( a green chart). As a point of clarification, there is one chart showing Internal to Internal zone trips placed within the External to Intermediate charted trips. This was simply for the purpose of saving space. It does however allow a comparison of the relative magnitude of trip kinds, and this kind of comparison helps in analyzing appropriate transportation facilities for given kinds of trips. All trips in LA County were said to be represented by these charts for what was then a projection for 1990.
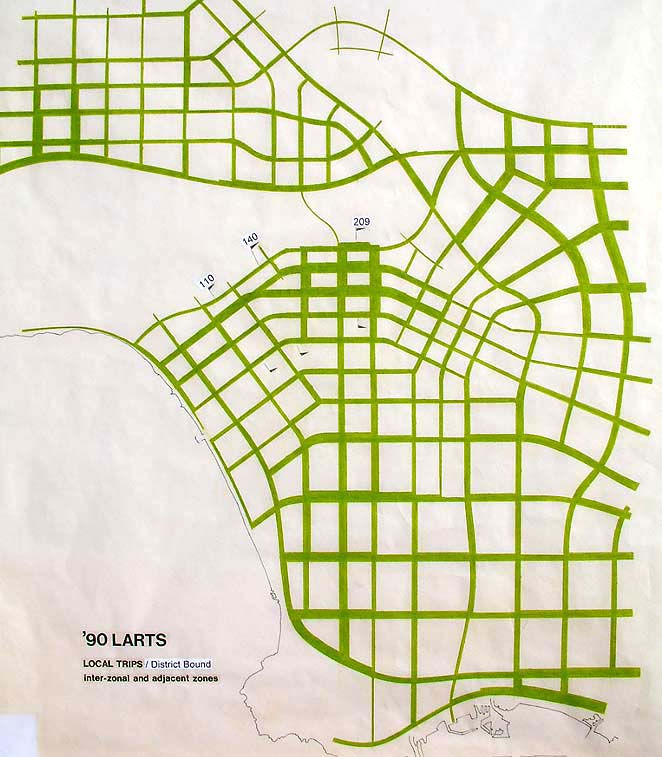
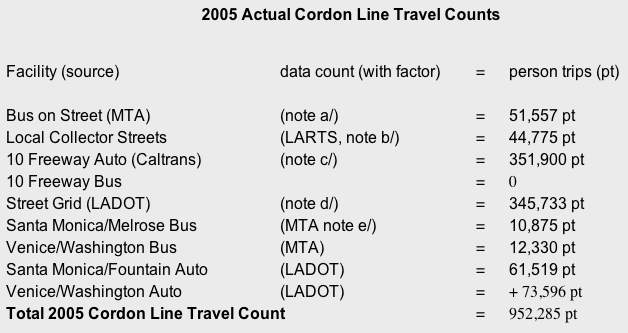
As a check and update on the 90 LARTS volumes of travel, actual travel counts on facilities (streets) and modes (auto or bus) with 2005 data was used for comparison. The 2005 data comes from the MTA, LADOT and Caltrans. As a means to compare these diverse data a common cordon line was established to check total volume.
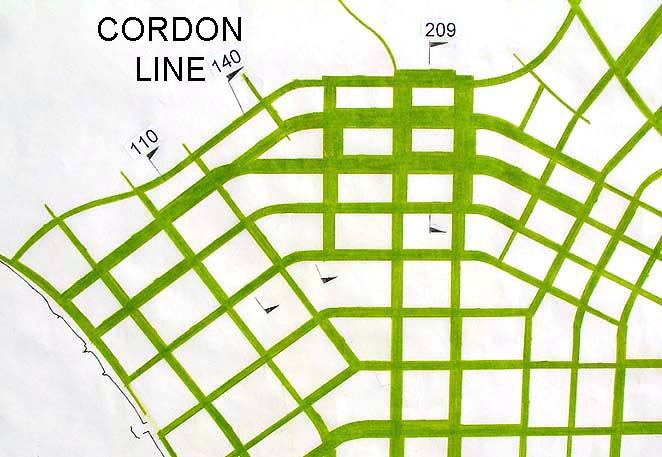
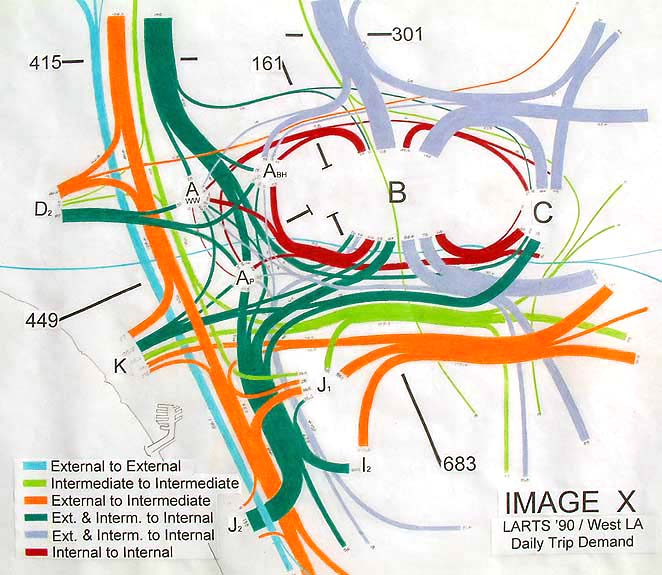
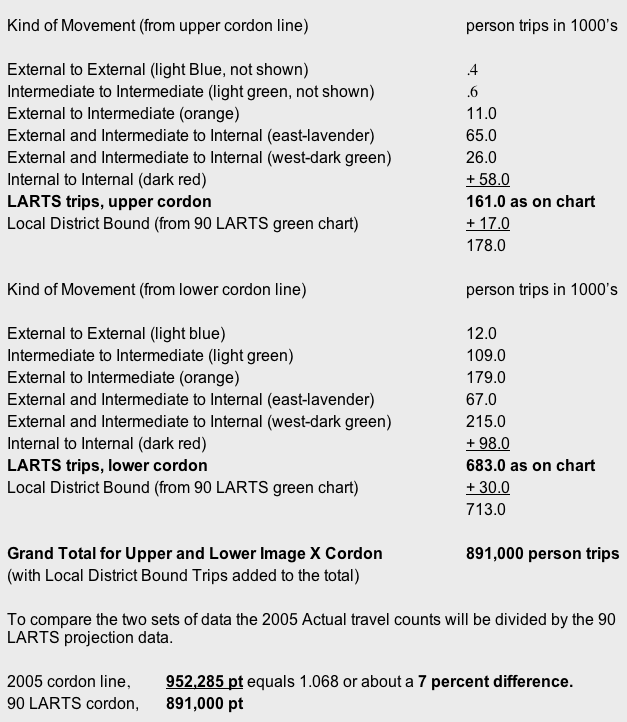
The cordon line runs essentially from the Hollywood Hills to the Baldwin Hills in the Fairfax Avenue alignment. The cordon line is to allow comparison of all east-west travel for the two data groups. The 2005 data on the cordon line was easily obtained and added together (see chart below). The 90 LARTS data showing kinds of travel and their respective origins and destinations required making an analysis of travel through the cordon line area and is represented by chart Image X. The cordon line volume on Image X is the sum of two grouping of trips, the 161,000 trips near the top of the image and the 683,000 trips grouped near the lower part of the image (don’t confuse these with some of the other cordon counts on the chart), giving a total of 844,000 person trips.
The two data groups give a good picture of what is happening with traffic. The 2005 data sharpens the amount of trips to be dealt with and the 90 LARTS data shows where it is going and where it has been by volume. It is interesting that the total volumes are less than 7 % different (see calculation below) with fifteen years between representations. It does tend to verify, however, that projections by transportation agencies are usually a bit exaggerated. The rational for the time difference is simply that it took longer to produce the actual traffic than was anticipated by the 1990 projection. The 90 LARTS data would represent a 2002 amount of traffic rather than 1990. So I trust my data and on the charts below where the 2030 projection is made the necessary refinements to the data is made and noted.
A couple of term clarifications will help the discussion. The term travel demand is simply the representation of persons wanting (or needing) to make a trip from one area to another like in the 90 LARTS charts or past a line as in our cordon line representations. There will be clarification made between vehicular (veh) trips, which can take more than one person, and simply person trips (pt) in the case of counting individuals. A factor increasing vehicular trips to person trips will be used and divided into person trips to covert to vehicles.
Footnotes:
#a The bus volumes for the FB corridors; Santa Monica Blvd, Melrose (instead of Fountain), Venice and Washington Blvd are excluded here but included in categories below.
#b no Agency keeps these (or makes available) these figures, so they have been estimated from the LARTS data.
#c 306,000 autos times 1.15 (factor) equals 351,900 pt.
#d without streets Santa Monica, Fountain, Venice and Washington
#e vehicles changed to pt with 1.15 factor multiplied.
Image X Cordon 90 LARTS Data
Note the color and width of line for the various kinds of trips on X.
Projection and Assignment
Note that the 952,285 pt (2005 actual cordon line total) becomes the gross number to project with for the 2030 35% increase in person trips. The various facilities will receive increases for the 2030 projection. The rational for each projection are noted at the bottom of the chart. Each of those numbers given to a facility (street grid, bus passengers, etc) themselves are part of the assignment. After those facilities with there increases are subtracted from the expected gross number of person trips for 2030 (1,289,590) the travel demand left over will be the amount allocated to the proposed Flow Boulevard facilities.
Projection and Assignment Chart
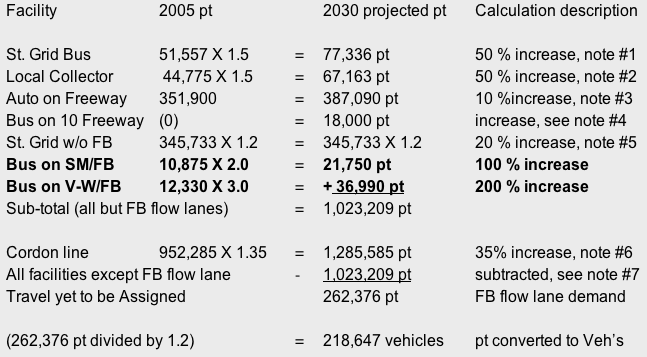
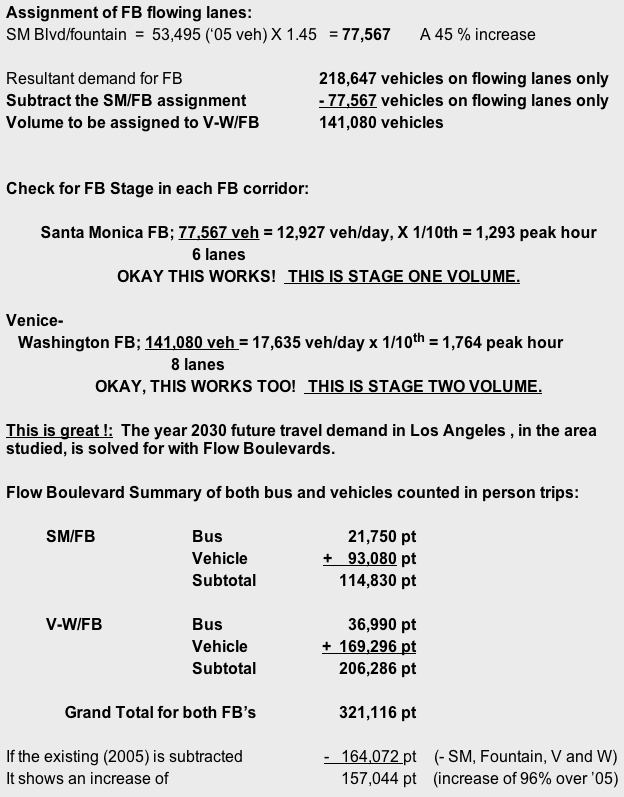
Resultant FB demand excluding bus; 218,647 vehicles assignable to flow lanes on Flow Boulevards.
The amount of travel demand, 218,647 expressed in vehicles, is the amount that will be assigned to the flow lanes of the two Flow Boulevards below. First the notes to the work above will be stated.
Footnotes:
#1 A 50% increase in bus ridership is expected on lines that go along existing single family dwelling in areas where not a lot of growth is expected but will still participate in an overall improving bus system. This amount is without Santa Monica , Melrose (in place of Fountain), Venice and Washington .
#2 these are district bound trips not leaving a district and not registering on major arterials for the most part. The LADOT does not collect data on this category of trips. Side streets and local collector streets are the primary reside of these trips and a large percentage of these trips will not affect the future network even though they increased by fifty percent, in that it is expected this kind of trip will be taken over by walking, biking and other non-vehicular short trips in the more urban setting.
#3 in computing the freeway persons per vehicle for 2030 the factor was increased from 1.15 to 1.25. There will be more persons but the same number of vehicles on freeways; hopefully a higher level of service and additional buses.
#4 with bus service improving generally, people will expect and receive bus service on freeways.
#5 the ’05 LADOT street grid (basically arterials) without Santa Monica Blvd, Franklin, Venice and Washington Blvd is 300,637 times factor 1.15 equals 345,733, times 1.2 for the 2030 projection gives 414,880 person trips
#6 the increase for travel demand growth has been reduced from the 38% implied by the SCAG 2030 projection to 35%. Shorter trips in a more urban setting is the main reason.
#7 the 1,023,209 pt amount ( which includes all transportation facilities except the FB flow lanes) is to be subtracted from the 2030 projection of 1,285,585 pt in order to get the resultant unassigned amount that will be assigned to the FB flow lanes.
Flow Boulevard Assignment
At this point the resultant travel demand of 218,647, expressed in vehicles, is to be allocated to the flow lanes of the two Flow Boulevard I have selected. Santa Monica Blvd. and Fountain Avenue are paired to accept the travel demand of the upper portion of the Image X cordon line. This corridor, though not an easy corridor to convert to FB operation will just be given a Stage One task to perform to. The FB corridor to respond to the lower travel demand on Image X is the Venice-Washington FB.
Discussion, Evaluation and Projection Refinement
There are two main issues the travel demand analysis brings forth.
Issue One: That the FB system would really make mass and rapid bus transit in Los Angeles work.
Issue Two: That if the automobile and other vehicles are not accommodated with improved access, there is really going to be congestion, economic breakdown and transit will not work either.
Issue One: Making transit work. The above 2030 projection included an increase of 106% in transit person trips through the study cordon line (from 74,762 pt in 2005 to 154,076 pt in 2030). The existing 2005 percentage of total person trips through the cordon line is just 7.85%. The 2030 projection above, with an increase of 106% over the existing transit amount , still just brought the transit percentage to 12% of the total trips through the cordon line in 2030.
Even though the FB system can give a 106% increase in transit usage over the existing, it can probably do more because of the exclusive bus lanes and an emerging FB Network if begun. As a network of FB’s is established, and reinforcing one another; it would be recognized that buses on FB’s can move in 20 mph plus averages making more ridership take place. A near doubling of the present percentage to 15%, of the total pt through the 2030 cordon line, would seem possible. Beyond regular boulevard bus service and an exclusive lane established on Wilshire there would be; a pair of stage one FB exclusive bus lanes, a pair of stage two FB exclusive bus lanes and bus service on the 10 freeway (probably not exclusive but working well). The “doubling” of the percentage of total transit trips through the 2030 cordon line would be as in the chart below.
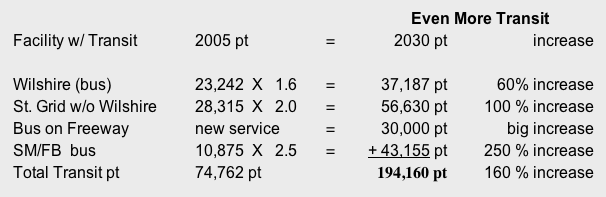
The 194,160 transit person trips would be a 160 % increase over the current amount of transit trips through the cordon line, but just a doubling of the transit trip percentage of total 2030 person trips or just 15% of trips.
The money issue, with making transit work, is clearly on the side of Flow Boulevards. And the issue of getting transit improvement where people are and where they want to go, is also on the side of Flow Boulevards. By spending the “subway to the sea” money on FB corridors I would expect 100 miles or more FB would be built by 2030. And by spending the Expo Line money on buses, they would be fully outfitted.
By looking at the large movements of travel demand on the 90 LARTS diagrams and then looking at the citywide FB Network proposed on this website (LAFB Network), it can be seen that they match very well. The first chart to look at would be the External exchanging with Intermediate. These are freeway trips but many of these are potential FB trips as well. In the E – F corridor (Valley) there are 143,000 trips. In the M-N-K corridor (405), there are 128,000 trips. In the I-J-K corridor there are 179,000 trips of the External to Intermediate kind. But as can be seen these movements are all around LA. This kind of movement is then added to the movement on the second chart, the Intermediate exchanging with Intermediate and the External exchanging with External trips. Again there are freeway and FB kinds of trips with heavy volumes; E-K corridor 69,000, I-J-K corridor 84,000 trips, D-K-J corridor 86,000 trips. The third chart to look at is the Internal exchanging with External and Intermediate or the surrounding Valley, East LA and South Bay exchanging with the Westside (the study area). Big volumes, but the internal districts A-B-C are all attracting big volumes. The A+B area is bigger than the downtown, district C volume area. It would be understood that the A area is probably bigger than represented here in that in the 1980’s Westside growth around the 405 was probably underestimated. The fourth group of movements is the Internal to Internal exchanges. The small distances and the relatively small volumes let this chart fit in the center of the Internal exchanges with Intermediate chart previously viewed. These are the A-B-C exchanges. Just by area and volume alone it can be seen that if six billion were spent on this little area instead of a network that serves this area and all the previous chart areas and volumes, it would not make sense. This issue is dealt with more directly with the Image X analysis above. A further discussion of the A-B-C exchanges however, is made below in Issue two. The study above, dealing with the projection for 2030 and the resulting assignment to transportation facilities, shows that the match up of travel demand and transportation facilities to accommodate that demand, using Flow Boulevards, works very well. Big travel demands require high capacity facilities to accommodate them. It should be likewise for the rest of the city with varying conditions and amounts of facilities, in that a FB Network can pick up much of the emerging volumes of medium and even long range trips, as well as the needed transit expansion of trips in Los Angeles . Further refinement and study of the FB assignment for 2030 is made below.
Issue Two: Improved access for vehicles
Whereas it can be seen that getting a higher percentage of transit trips is a worthy objective, it should be recognized that automobiles and other vehicles must be accommodated or the majority of transportation movement breaks down along with economic viability in Los Angeles . These systems are interdependent. The above 2030 projection with Flow Boulevards would have 88% of person trips in vehicles. If the 160% increase in transit person trips over 2005 is achieved, that still leaves 85% in vehicular person trips to be accommodated. The growth in vehicular trips from 2005 to 2030 is 29% (253,986 pt or 211,655 vehicles, or a grand total of 941,500 vehicles through the cordon in 2030).
Vehicular growth would be declining on a percentage basis, where as transit growth would be increasing. But transit trips will not exceed vehicular trips for generations if ever. What the FB corridor growth is about is developing higher density areas including housing, which promote transit, accommodates necessary vehicular trips and promotes walking, biking and shorter trips generally. Flow Boulevards are the key to making everything happen.
Flow boulevards take up the niche between freeways and regular boulevards. At the same time they are becoming major origins and destinations of major travel demand. The FB system is filling in a gap in the hierarchy of roads, bringing a citywide rapid bus system forward, providing the framework for a denser urban environment and countering sprawl and the wasting of resources with low density development of the country side.
.
It is now time to follow through from the 90 LARTS diagram discussion (in issue one above), and look at a more detailed segment of the proposed FB network, with a discussion of Image X.
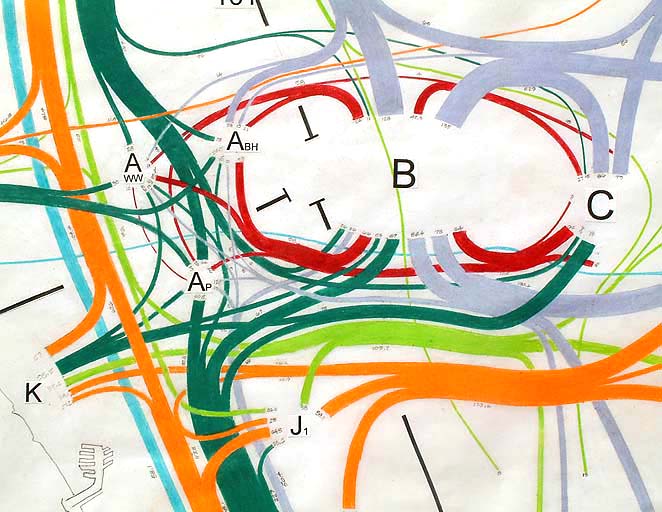
Upper Image X: The upper portion of image X shows a cordon line of 161 (thousand pt or k). Looking for the major travel demand, it is first identified by the westerly (dark green line) External and Intermediate to Internal travel demand of 26k, then the easterly (lavender gray line) of External and Intermediate to Internal demand of 65k, then there is an External to Intermediate (orange line) that should be recognized of 12k. This adds up to 103,000 pt of long and medium length trips that should be accommodated with a major transportation facility. Giving this amount an increase of 25% for a projection of increased trips for 2030, this would give 128,750 pt of demand. In the 2030 projection, the stage one SM/FB was allocated 114,830 pt. So there is a deficiency. I think this will still work however. The projection of medium and longer trips was 25% and not 35% because there will be the desire of people to live closer to work, and as well the notion that there will be fewer longer trips and more shorter trips in a more dense, more complete urban community. With the projection giving just 19% of the allocated pt to bus in the SB/FB, there should be more room for buses or maybe the planned exclusive bus lane is not so but mixed with vehicles thus giving a higher pt total for the SM/FB. Let us say that instead of 6 flowing lanes, by using half of the bus lane each way an extra lane in effect is gained giving 7 flowing vehicular lanes for the corridor.
The revised calculation would be like this. Seven flowing vehicular lanes times the 1293 veh/hr times 11 hours times 1.2 (convert veh to pt) equals 119,473 pt capacity. Add the bus pt of 21,750 and the total pt for the SM/FB is 141,223 pt. Subtracting the projected 25% increase in medium and long range trips for the corridor gives 12,473 pt extra capacity. This extra capacity will be filled up in the following way. Of the Internal to Internal district exchanges, between A-B-C only 4,000 pt has been allocated from C to A in the SM/FB corridor. The reason for this is that there is little demand in the LARTS data from upper C (Mt Washington and vicinity) to Upper A ( Beverly Hills and Westwood). Giving it a 25% increase for 2030 to 5,000 pt and subtracting it gives only 6,473 extra capacity in the SM/FB corridor. So the SM/FB works with the revised allocation given the new circumstances of urban circulation in 2030, and accepts the medium length trips as is so very much needed. The remainder of extra capacity in the corridor will be taken by short trips, specifically trips exchanged between A and B.
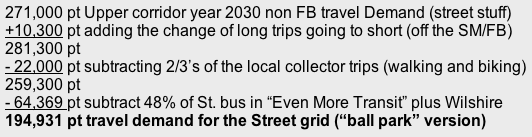
I will now come up with a revised “ball park” street allocation for the 2030 projection for the Image X upper corridor that reflects the changes in urban mobility. The total non FB 2030 demand for the upper corridor (which includes bus and auto on streets) is about 271,000 pt (about 48% of the entire cordon line excluding the flow boulevard bus and auto). Note below:
The question is, “The Flow Boulevard works, what would the regular street traffic be like?”
The answer is, the regular street traffic would be about the same as today. And that would be with an increase of 38% in population in Los Angeles .
To look at some detail of the shorter trips, of the 58k pt in the Internal to Internal (dark red lines) demand, only 4k is medium length going from the C district to A (as mentioned before). The other 54k of Internal to Internal trips are going from upper B district to Abh (Beverly hills) 22k, from upper B to Aww (Westwood) 16k, and upper B to Ap (Palms area) with 20k. These short trip movements can be taken on what has been referred to as the Street Grid (regular boulevards) as calculated above. In the 2030 allocation of trips to the SM/FB, 21,750 pt or 19% of the trips were bus pt and there were 77,567 vehicles allocated to the stage one flow lanes.
To give a quick summary for the upper portion of our cordon line, the 2030 projected traffic seems to fit into the various transportation facilities rather well. Long and medium trips, as well as an increased percentage of transit trips are all taken by the stage one FB. Short trips on bus and vehicle are taken adequately by existing regular boulevards with about the same level of service as today. And finally really short trips are becoming walking, biking and other mode trips.
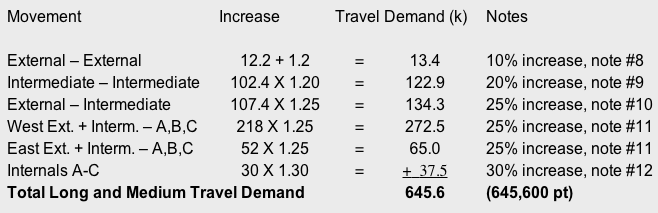
Lower Image X: Referring back to the 2030 35% increase projecting 1,285,585 total person trips for the cordon line, the upper image of 412,223 pt can be subtracted to arrive at the amount the lower portion will have to accommodate or 873,362 pt. This inspection will be making sure the long and medium trips are given adequate accommodation by appropriate facilities. As further reference, by adding the 10 freeway (387,090 pt) and the V-W/FB vehicular pt (169,296 pt) along with the 10 bus (30,000 pt) and FB bus (43,155 pt) mentioned in the “Even More Transit” scenario, the total would be 629,541 pt as the likely capacity of the long and medium length trip facilities in the lower cordon line.
Following the lower portion of Image X, this will guide the inspection as to how well the proposed V-W/FB and 10 freeway will be accommodating the 2030 travel demand as projected. The following chart will add up the travel demand to be compared to the 629,541 pt capacity called out above.
Footnotes:
#8 growth in the westerly external district ( Malibu and Pacific Ocean ) is limited.
#9 growth is some what limited in the westerly Intermediate District ( Santa Monica ).
#10 district exchanges between J,I with P,Q & R that are shown on the Image X diagram do not assume a high capacity facility south of the 10. The increase for 2030 will assume a Slauson FB to attract 40% of these trips in the future. Therefore the movement was reduced 40% before the 25% increase.
#11 this movement falls into the “less long trips” scenario therefore just an 25% increase, not a 35% increase.
#12 this medium length internal trip is included on the FB facility.
The travel demand of long and medium length trips of 654,600 is just 2.5% over the 10 freeway and V-W/FB “likely capacity” set out above. I think this demand is easily accommodated by a 70 minute “peak hour”. So again, the various long and medium travel demand trips fits nicely with the proposed transportation facilities. The next inspection is to see how short trips are accommodated and what the street “traffic” is like.
It was established above that the total travel demand for the lower portion of the 2030 cordon line is 873,362 pt, and subtracting the long and medium trips of 645,600 leaves 227,762 pt to be taken by the regular street system. Note the following calculations.
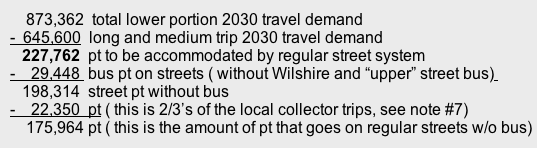
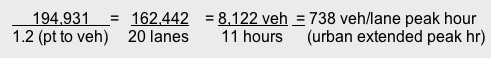
The final calculation is to distribute the remaining pt to the eighteen regular boulevard street lanes to see if there is congestion.

As a summary for the lower portion of the cordon line study, we find that the 2030 travel demand long and medium trips are adequately accommodated by the second stage V-W Flow Boulevard and the 10 freeway. It should be noted that the 10 freeway did not receive an increase in vehicles (other than buses), just an increase in persons per vehicle. So the freeway should have a similar level of service as today or better if some small improvements can be made to the 10 or if there is an extended peak hour period (responding to different travel characteristics). And the final piece of the puzzle, the regular street system, we find that there is essentially the same vehicular level of service and with more transit ridership. Regarding transit, it should be noted that there has been some 75,759 additional bus person trips through the lower portion of the cordon line accommodated with this transportation proposal. The total bus person trips added for the upper and lower cordon is 119,398 pt as per the “Even more Transit” scenario (a 160% increase over 2005). Adding that to existing bus pt gives a grand total of 194,160 pt through the cordon line.
As a final summary, since both the upper and lower portions of the cordon line are accepting the projected 2030 kinds of trips with appropriate transportation facilities it simply means the Flow Boulevard approach to transportation improvement is the answer to future travel demand in Los Angeles. Quite frankly, proposed rail transit can not accommodate the large travel demand movements described in this analysis. Proposed rail is in the wrong place, not enough of it can be built to make a real system, it would not connect to the extensive and diffused areas travel demand requires; it is really an outmoded, unaffordable commuter rail service that denies expenditure on real problem solving transportation improvement that answers the needs of future travel demand and conservation wise city form. The Flow Boulevard system will answer the transportation needs and the environmental needs of Los Angeles . With that, a continuation with the last portion of the FB Elements will follow below.