FLOW BOULEVARD
LA City and County Overview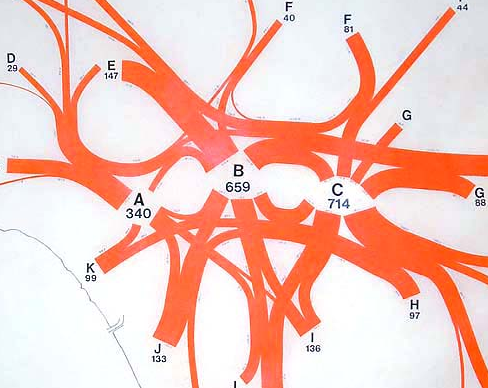
Abstract
This study shows that the proposed rail system does not begin to address the amount of transportation improvement necessary for mobility needs nor would it be responsive to recent new planning criteria. What should be included in City and County plans is a low cost extensive network of improvements and plans to distribute population growth on that extensive network creating efficient home to work trips. Long term, in order to secure the future of the Southern California Dream, a totally integrated system primarily with electric vehicles may very well be the transportation goal. There is a great need for planning that allows for flexibility in order to be able to respond to new problems while taking care of the over 90% of trips in LA County which are vehicular. What we have is an economic situation that leaves us vulnerable because very expensive rail takes up a large part of the improvement budget with narrowly conceived goals that would serve but 3% of County trips when all the Measure R improvements are in place. (Comments made in 2010 follow)
PowerPoint to the Alliance
By Phil Brown, Architect 9/09
This presentation is about how the Flow Boulevard (www.flowboulevardplan.com) transportation concept can benefit Los Angeles but it is also about recent major changes in planning criteria that have occurred but are not yet reflected in plans by Metro or the City Planning Department.
I would like to begin with a quote by Paul Valery, a French intellectual and social critic in the early twentieth century.
“Politics is the art of preventing people from taking part in affairs that properly concern them.”
This can apply to residential interests in the Los Angeles Basin as well as the area the Alliance is involved with. It is a condition where residents are victims of misinformation and lack of information. We are now beginning a phase where the economy is entering a period of credit contraction, peak oil will diminish energy supplies, global warming is said to threaten world climate and environmental stability. These are major changes the kind that mean leaving an old economy and trying to enter a new economy. Many believe this to be so and a socio – economist by the name of Jack Lessinger calls this phase “schizomania”. This is a condition where old ideas and new ideas are in conflict trying to direct social and economic activities of the society at large. In this case the City planning effort in Los Angeles is caught up in varying old and new ideas for transportation improvement and plans for growth to serve the residents of Los Angeles.
New planning criteria are coming from three main areas.
1. New Legislation At the Federal level the Clean Air and Security Act is on its way to passage. At the state level SB 375, the “anti sprawl” bill is already law in California. In combination this means a 90% reduction in fossil fuel emissions by 2050 and reduced Vehicular Miles Traveled by our new city plans. These are criteria that affect transportation planning at first by the need for fuel conservation, then over time it essentially means a total transformation to electric vehicular travel. This especially means automobiles. It also means city form consolidation such as in the Los Angeles Basin and elsewhere.
2. Replacing the Broken Economy of Excess We will not return to the consumer excesses our economy has just taken a fall from and what was largely supported by “sprawl” here in Los Angeles. Sprawl has been a kind of under lying strength of the Southern California lifestyle, but now it presents a definite vulnerability. The subjects of transportation improvement and land use development will change in the process of urban consolidation and vehicular transformation to essentially an all electric transportation system. These changes will as well go a long way in the formation of a new economy in LA.
The heavy burden of the misallocation of resources in suburban sprawl has to be rethought and countered with effective planning, and conceptual and technological innovation regarding city building. Flow Boulevards will be a significant element in this regard.
3. Change must occur quickly and affordably Redirecting and reforming the development profession and its activities is a part of the new changes that will occur. There will typically be much more public involvement with the major “infill” development process. And it will be a new approach to recent big spending attitudes because it must be done quickly and affordably.
The following information is meant to compare Metro planning with other planning ideas. Some of those ideas consider what benefits the Flow Boulevard (FB) concept can offer. Metro in comparison is challenged because their approach is based on a planning concept that is stretched too large, costs too much and takes too long to deliver the transportation needed in Los Angeles County in general and in the LA Basin in particular.
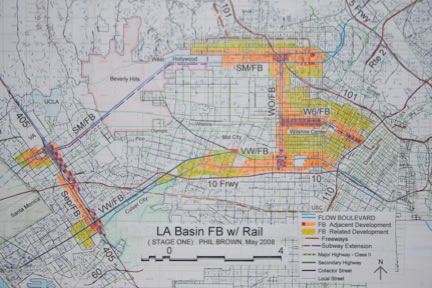
Slide 1 ; LA Basin FB Loop
The Loop Plan focuses on the idea that FB’s are affordable, integral with the existing planning context and provide the basis to evolve that community context with the Flow Boulevard characteristics of higher transportation capacity within existing Rights of Ways, a more dense housing and land use corridor where it is needed and that Flow Boulevards can protect existing residential communities and infrastructure from impacts where they need to be protected.
Flow Boulevards are consistent with reducing vehicular miles traveled due to the fact that vehicular travel is the main form of travel in being reduced. First conserve by eliminating congestion and finally to transform to an all electric mode to eliminate fossil fuel dependence and CO2 emissions. It should be recognized that transit, especially rail transit will remain as supplementary in providing transportation in LA and will have little effect in reducing vehicular miles traveled as well as reducing CO2 emissions.
Considerations on the Basin Context. (a new economy?)
1. Consolidation pressures; 150,000 new dwelling units in 25 yrs.
2. Transportation pressures; Freeway congestion pricing, and more traffic following the development following the subway.
3. Confine most growth to the FB corridors rather than R-3 sprawl.
4. FB’s provides desirable new urban pedestrian O.S. and circulation.
5. FB corridors provide a basis for new building methods & products.
6. Block Development Corps; wide participation/land aggregation.
The LA Basin FB Plan (below) is a preliminary plan to accommodate the above planning pressures regarding transportation and land use. A greater amount of explanation is provided at www.flowblvd.com.
Slide 2 ; Metro Transit: radial plan fixed guideways; does not serve but a small percentage (2%) of LA County trip mileage.
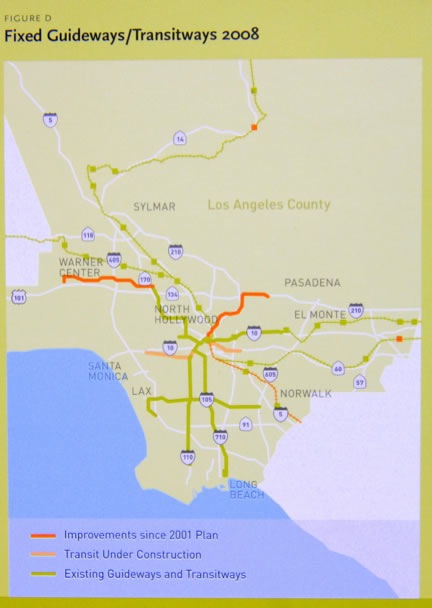
Slide 3 ; Measure R may add from 150% to 250% in rail and exclusive transit ROW. However just to stay even with the total transit share of 7% of the total person trip mileage in LA County (2005 yr) the bus transit needs to be increased by 100% (boardings) and the exclusive ROW transit needs to be increased by 970% (boardings). To take 25 years and $40 billion yet only to remain at 2005 levels of transit share of trip mileage is “totally inadequate”! Metro is conceptually behind the time.
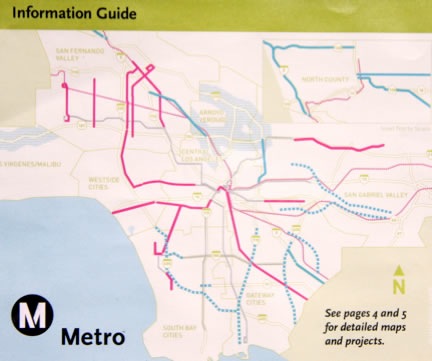
The above Metro Information Guide image has been taken from a brochure/advertisement that was mailed out to residents prior to the November 2008 vote. Better plans with more up to date criteria must be developed for these limited “R” resources to have beneficial effect.
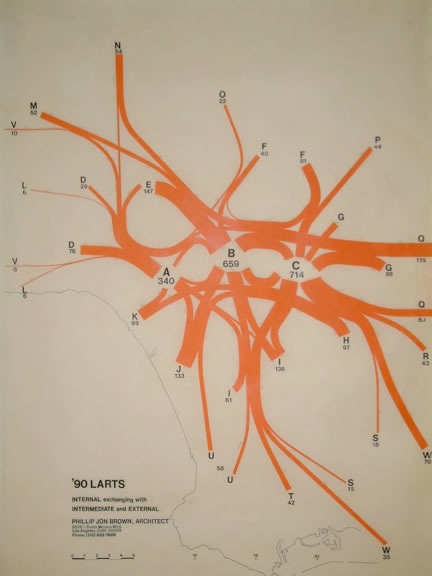
Slide 4 ; LARTS District Map The Internal area (ABC) on the map in essentially the LA Basin area going from approximately Westwood to Downtown LA. Intermediate Districts surround the internal areas (example “E” greater Van Nuys). The External Districts in yellow and brown are further out still (example “N” generally the Chatsworth area. 2002 volumes on the orange charts that follow this map show the travel demand from District to District. This is the start of the Manual Assignment Transportation planning Technique. The following charts have the benefit of being “seen” as opposed to being locked in the “black box” of the computer.
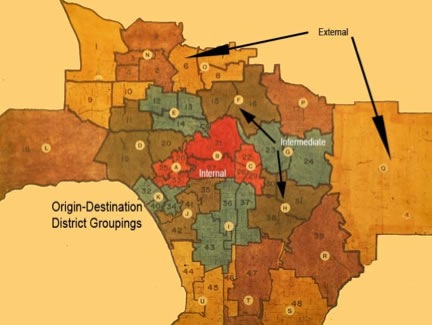

Metro rail investment essentially does not address this travel demand. Note; the image in orange is on the following page where width of line denotes daily volume of person trip demand.
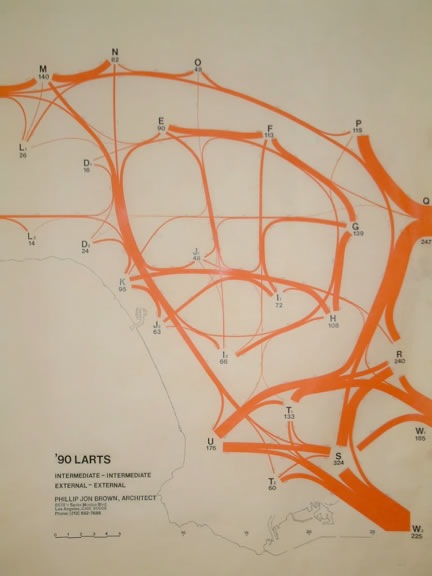
As an example of trip demand the 176 seen below the letter U stands for 176,000 trips per day going and returning to or from District U. Note that the ’90 LARTS data really reflects year 2002 actual trips when compared to actual trip counts made in the 2002 time period.

Again Metro transit barely serves these movements. 96% vehicular
![]()
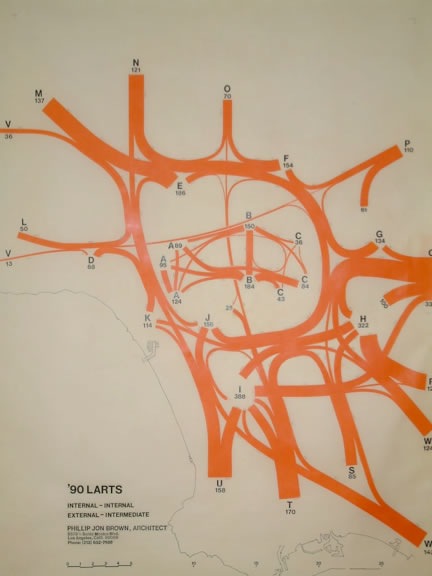
These are commuter trips. Rail and bus comprise about 9% of trips.
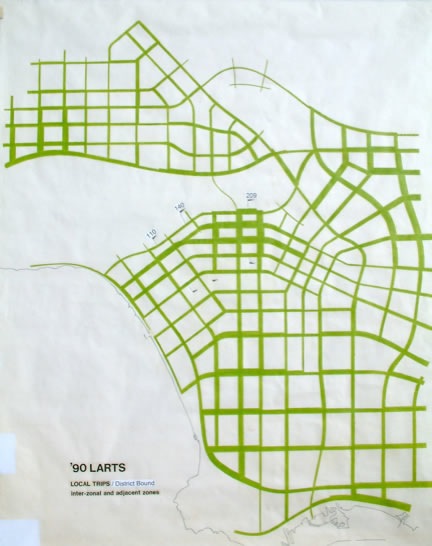
Slide 8 ; District Bound Trip 8.0% estimated travel demand of the total travel mileage for LA County. These are short trips that do not leave their district. (For a transit use reference; a cordon line running from the Hollywood to Baldwin Hills gives a 7% share of total trips.)
Comment; Metro is spending lots of money and not coming up with much transportation. It is certainly deficient given recent criteria. What is being called for by The Clean Energy and Security Act along with Bill SB 375 is a near total transformation of all transportation modes to electric power. This emphatically means automobiles. Therefore the main path to attaining environmental and clean energy objectives is through the electric automobile and in providing for surface travel improvements, mainly Flow Boulevards in this regard. To conceptualize this enormous task simply think that in the next 40 years on average every 8 years a newer automobile that is itself becoming greater in fuel efficiency (maybe hybrids) to eventually “plug ins” is purchased. That would average out as 5 complete “fleet” vehicle changes in 40 years in the LA Basin. It is similar to the 85% particulate clean up that has occurred with the internal combustion engine in the past 30 years; a transformation in itself accomplished by simply buying better autos. What may be the difficult part is supplying the needed amount of electric power to run the all electric transportation system (geothermal and nuclear being likely sources for the needed electrical power).
Flow Boulevards provide exclusive lane rapid bus transit at a very affordable price and bring conservation of existing energy resources by eliminating vehicular congestion in our urban areas. Building a network of Flow Boulevards brings a citywide system quickly and affordably. This network is open to the evolution of technological advancements allowing the total transformation process to come about. A preliminary 135 mile FB network for LA is on the website.
The average length of trips in 2002 was about 15.5 miles. This also has to be reduced. The Flow Boulevard concept is conceived of as a high population density corridor as well as high capacity transportation corridor. This will help reduce the total amount of VMT (vehicular miles traveled).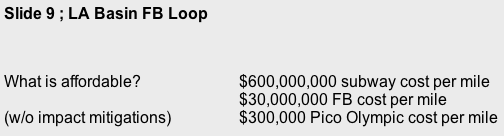
FB’s more than pay for themselves; 144 million/ mile in 20 years. This cost/ revenue description is presented online at www.FlowBoulevardPlan.com in the LA Flow Boulevard Loop Plan segment. It is derived from LA City Revenue and Expense information that shows how the increased revenue from Flow Boulevard property development more than “pays its own way” for FB development.
Note that the majority of land use redevelopment occurs near Downtown. Existing established residential communities are “protected”. Again, read the FB Loop Plan online for greater detail.

The “established” residential community issue regarding transportation has a great deal to do with traffic and land use impacts on communities that do not need “redevelopment”! These communities, their land use and transportation infrastructure, would be impacted greatly by the surge in development brought about by introducing increased regional commercial development in the center of the LA Basin that would follow a subway down Wilshire between Western Avenue and La Cienega. The impacts have been explained to a greater extent online.
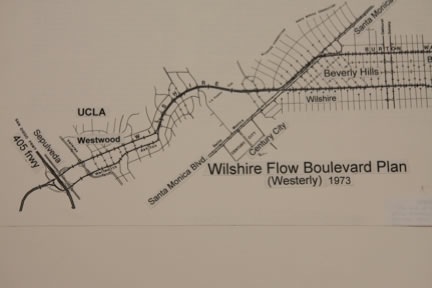
Slide 10 ; Wilshire Corridor FB (1973)
The first thing that should be said is that a Wilshire Flow Boulevard Plan shows a plan of What Not to Do in the LA Basin. I made the Wilshire FB Plan in 1973 before I had made the Travel Demand Study (the orange Diagrams). So this demonstrates the folly of making plans without knowing what the magnitude and direction of Travel Demand is. The importance of the slide here is to reference How the Flow Boulevard Works (also online) and that an irresoluble bottleneck in Beverly Hills would be made by the regional commercial development following the subway along Wilshire (also online).
Slide 11 ; Subway Extension Route Alternative #11
The Metro Alternative #11 shows subway development in both the Santa Monica Boulevard (SMB) and the Wilshire corridors. The subway segment between Western Avenue and La Cienega is the segment that would have a domino effect of traffic and land use impacts on the centrally located established residential communities. Solution; leave out the segment between Western and La Cienega! At a minimum omit that segment as the first minimum operational segment (MOS) and make the SMB segment the first MOS to be built. A better idea; by omitting the 4 miles of subway that creates the bottleneck in BH, it pays for the 30 miles of FB Loop in the Basin thereby eliminating congestion in the LA Basin and conserving energy and lessening environmental impacts.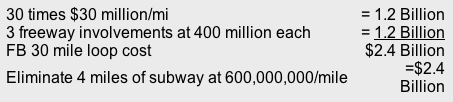
The point: Much more transportation is provided by 30 miles of FB.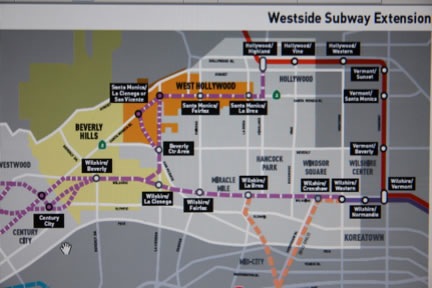
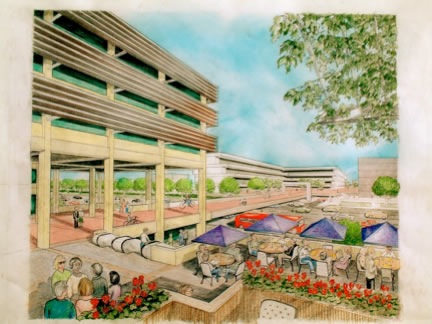
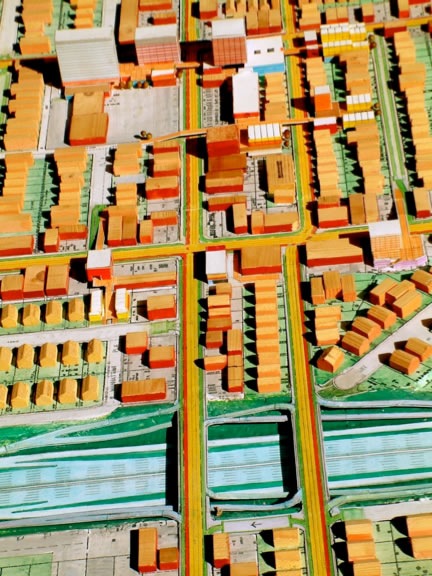
Slide 12 ; A FB Connecting to a Freeway
This is a model view of Western/Oxford FB connecting to the 10 freeway. Major expenses such as this are affordable in light of the very affordable FB average mile cost.
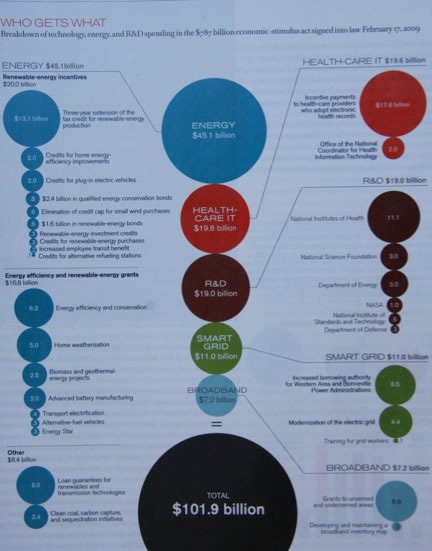
Slide 13 ; Stimulus 101 (An illustration from MIT’s Technology Review. It is in a way an outline for the “new economy” that must become a part of our city economy.)
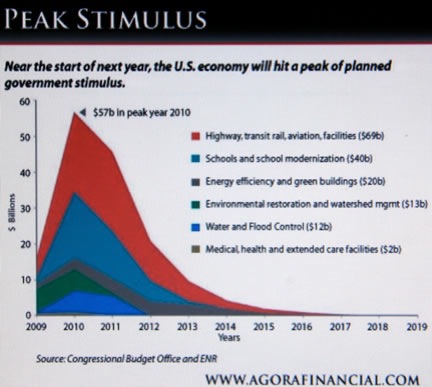
Slide 14 ; Peak Stimulus
The government stimulus runs out very quickly even if it is to occur. For that reason low cost transportation improvement that involves a large part of LA and the out of work labor force makes the FB system the appropriate choice for development at this time. This would stretch those Measure R dollars making their benefit meaningful. Also in this same line of reasoning the FB roadway improvement (including the mitigation to protect adjacent residential areas) and then the housing and land use redevelopment that follows lends itself to the development of the revived and “new economy” that Los Angeles needs. The legislation is there (anti-sprawl SB375) so it is logical to develop growth “in town” near work centers starting now!
Slide 15 : FB’s Make a New Pedestrian Open Space System
The FB system is essentially a development with three stages. The First Stage still has pedestrians crossing the boulevards at grade with the signals that have been synchronized for the traffic flow (approximately 1200 vehicles per lane per hour). Stage Two has a number of elevated pedestrian crossings in conjunction with adjacent architectural development. This allows even more gaps to be removed between vehicular groupings and longer groupings, therefore greater vehicular capacity ( approximately 1750 vehicles per lane per hour). To get a better idea of how these elevated pedestrian ways develop, take a look online at www.flowblvd.com in the Elements and Travel Demand segments. There are stages One and Two developments portrayed separated by a treatise on Travel Demand. Stage Three (approximately 2300 vehicles per lane per hour) has a completed elevated pedestrian circulation network; long enough so when the FB goes back to a Stage Two portion of FB that there is no back up in traffic. Building higher density makes higher capacity boulevards by making separated pedestrian open space.